Check LMDB Usage
Presentation
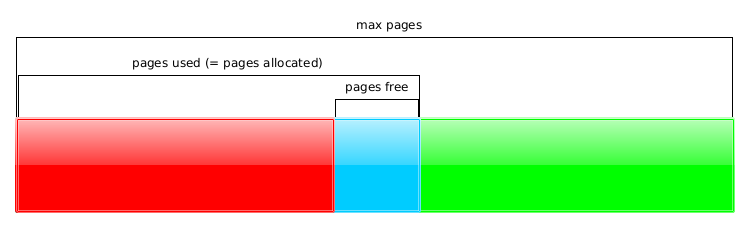
This plugin checks percent of pages used and pages free in an LMDB database.
The calculation is based on this formula:
\[\]
$$really\,used = \frac{ pages\,used - pages\,free}{max\,pages}$$
For example:
$ perl check_lmdb_usage.pl -H /usr/local/openldap/var/openldap-data -w 30 -c 20 -r
OK - 65% pages used / 34% pages free
With performance data, it allows to create graph to follow evolution of this indicator.
Configuration
Required Perl modules:
Getopt::Std
You also require the mdb_stat utility.
Usage
$ perl check_lmdb_usage.pl -H <db_home> [-S <mdb_stat>] [-h] [-v] [-V]
Mandatory Options
- -H
Home of MDB files
- -w
Warning threshold in percent
- -c
Critical threshold in percent
Other options
- -S
Path to mdb_stat utility
- -v
Verbose
- -V
Print version and exit
- -h
Print help and exit
- -f
Performance data
- -r
Reverse mode, use warning and critical levels for free pages instead of used pages
Download
This plugin, along with all other Nagios plugins from this site, can be downloaded in a single archive.