LDAP response time
Presentation
This Cacti script measures LDAP response times on 3 operations:
A bind
A search on the RootDSE
A search on a naming context
Here is a generated graph example:
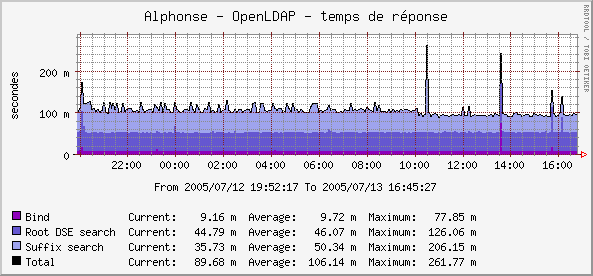
Download
This plugin, along with all other Nagios plugins from this site, can be downloaded in a single archive.
Installation
You have to copy the perl script in Cacti scripts directory (for example /usr/share/cacti/site/scripts/ on Debian):
$ cp ldap_response_time.pl /usr/share/cacti/site/scripts/
Then go on Cacti administration panel and choose “Import template”. Select the XML local file shipped with the script and “save”.
Configuration
You can edit the values of command line parameters by modifying the Data source template.
Choose “Data Templates” and click on “LDAP - response time”. You can see at the bottom the “Custom Data” table. Parameters are:
Host or IP
Port
Connection account: anonymous bind if not defined
Connection password
Timeout
LDAP protocol version
Suffix: “auto” means the script will discover the naming context from the rootDSE. You can also specify one naming context here (for example “dc=example,dc=com”), or use “none” to disable searching on the suffix (useful for LDAP proxies).
Data source creation
In the Cacti admin panel, choose “Data Sources” and click on “Add”.
Select the “LDAP - response time” Data template, the host, and “save”.
Graph creation
In the Cacti admin panel, choose “Graph Management” and click on “Add”.
Select the “LDAP - response time” Graph template, the host, associate the data sources and “save”.