OpenLDAP operations statistics
Presentation
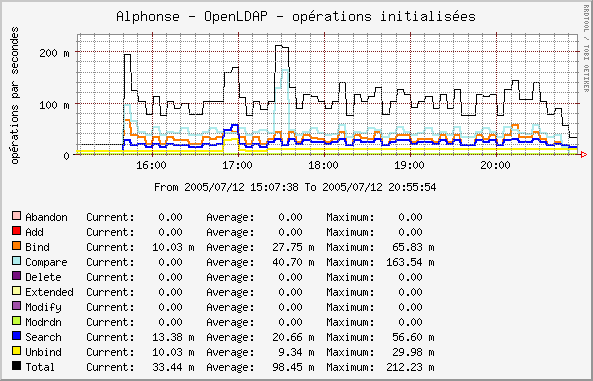
This Cacti script displays the number of initiated LDAP operations on an OpenLDAP server:
abandon
bind
unbind
compare
search
add
delete
modify
modrdn
extended
It uses statistics collected in OpenLDAP Monitor backend (cn=monitor).
Here is a generated graph example:
Download
This plugin, along with all other Nagios plugins from this site, can be downloaded in a single archive.
Installation
You have to copy the Perl script in the Cacti scripts directory (for example /usr/share/cacti/site/scripts/ on Debian):
$ cp openldap_operations.pl /usr/share/cacti/site/scripts/
Then go to the Cacti administration panel and choose “Import template”. Select the XML local file shipped with the script and “save”.
Configuration
You can edit the values of command line parameters by modifying the Data source template.
Choose “Data Templates” and click on “LDAP - initiated operations”. You can see at the bottom the “Custom Data” table. Parameters are:
Host or IP
Port
Connection account: anonymous bind if not defined
Connection password
Timeout
LDAP protocol version
Data source creation
In the Cacti admin panel, choose “Data Sources” and click on “Add”.
Select the “LDAP - initiated operations” Data template, the host, and “save”.
Graph creation
In the Cacti admin panel, choose “Graph Management” and click on “Add”.
Select the “LDAP - initiated operations” Graph template, the host, associate the data sources and “save”.